


Bengaluru, 20th of January, 2025 : This white paper provides the accounts of various sources of coarse (PM10) and fine (PM2.5) particulate matter in BENALURU city. We define PM2.5 having diameter ≤2.5 micron and that of PM10 having diameters ≤10 micron). It explores in detail the emissions from the transport sector and analyses potential benefits under various scenarios of transitioning to Electric Vehicles (EV). It also quantified the reduction of emissions of pollution and associated health care cost benefits in each scenario.
Problem Statement:
Bengaluru is a metropolitan city located on the deccan plateau of Peninsular India. It is commonly known as the “Silicon Valley of India,” and the Bengaluru Urban District (BUD) spans approximately 2196 square kilometres. As of 2011, the population was about 8.4 million, with estimates in 2024 suggesting it has grown to over 12 million (BBMP, 2024). The city hosts a diverse industrial landscape, prominently featuring information technology, biotechnology, aerospace, and electronics sectors. The increasing population, industrialization, and private vehicle ownership is steadily increasing the release of dangerous particulates in the city (Mangaraj et al., 2022). Fine particulate emissions in the city is linked to many adverse health outcomes (Prabhu et al., 2022). Effective management to mitigate particulate matters requires addressing root cause and its origin at the source. Many emission inventories developed for the city highlights the importance of transportation sector in Bengaluru’s air quality (Guttikunda et al., 2019; Mangaraj et al., 2022; Beig et al., 2024). Hence a relative contribution of various sectors in emissions of particulate pollutants and sensitivity study to understand the benefits of transitioning to electric vehicles needs to be carried out which is attempted in this report.
Sources of Emissions and Share
Table 1 provides insights into the contributions of different sectors to PM2.5 and PM10 particulate emissions in Bengaluru city. Transport sector is the leading contributor to PM2.5 emissions, accounting for 39.11%, while its share of PM10 emissions is 23.71%. Industrial sector is contributing 24.16% to PM2.5 and 17.34% to PM10. Road dust emerges as the dominant source of PM10 emissions, contributing 34.31%, while its share of PM2.5 emissions is 13.69%. Municipal Solid Waste (MSW) and diesel generator (DG) sets are relatively smaller contributors, adding 7.95% and 5.47% to PM2.5 and 5.19% and 5.14% to PM10, respectively. Emissions from slum areas account for 4.15% of PM2.5 and 3.23% of PM10. Other sources contribute modestly, with 5.46% to PM2.5 and 11.08% to PM10. This data highlights the need for targeted mitigation efforts, particularly in the transport and road dust sectors, to improve air quality. Overall, the city experiences total emissions of 68.61 Gg/year of PM2.5 and 113.18 Gg/year of PM10.
Table 1: Annual particulate emissions from different sectors in Bengaluru (2023)
| Sources | Annual Emissions (Gg/year) | Relative share of Emissions (%) | ||
| PM2.5 | PM10 | PM2.5 | PM10 | |
| Transport | 26.84 | 26.84 | 39.11% | 23.71% |
| Industry | 16.57 | 19.62 | 24.16% | 17.34% |
| Road Dust | 9.39 | 38.83 | 13.69% | 34.31% |
| MSW | 5.46 | 5.88 | 7.95% | 5.19% |
| DG sets | 3.75 | 5.82 | 5.47% | 5.14% |
| Slum | 2.85 | 3.65 | 4.15% | 3.23% |
| Tire wear | 1.27 | 2.44 | 1.85% | 2.15% |
| Hotels | 0.93 | 1.15 | 1.36% | 1.02% |
| Construction | 0.64 | 6.37 | 0.93% | 5.63% |
| Road Wear | 0.62 | 1.14 | 0.90% | 1.01% |
| Residential | 0.19 | 1.30 | 0.28% | 1.14% |
| Cremation | 0.10 | 0.15 | 0.15% | 0.13% |
| Total | 68.61 | 113.18 | ||
Figure 1: Share of particulate emissions from various sources in Bengaluru
Transport Sector in Bengaluru
To formulate a more focused mitigation approach, it is essential to identify the vehicle classes that contribute most significantly to emissions in the city. This data empowers policymakers to prioritize initiatives, such as advocating for electric vehicles, augmenting public transportation, or enforcing
harsher rules, thus effectively mitigating pollution and enhancing air quality.
Figure 2 shows the composition of vehicles in Bengaluru city. With a vehicle population of ≈ 9.7 million as on 2023, Bengaluru Urban is one of the most vehicle dense districts in the country (MoRTH, 2024). The vehicle population in Bengaluru shows a significant dominance of two-wheelers, with 6.7 millions vehicles, accounting for 70% of the total. Cars follow, with 2 million vehicles, contributing 22 % to the total. Three-wheelers make up a smaller share, with 311,054 vehicles, constituting ≈ 3 %. Buses represent a minor fraction, with 100,760 vehicles, contributing just 1 % to the total. Light and heavy commercial vehicles account for 405,198 vehicles, making up 4 %. The data highlights the overwhelming presence of two-wheelers in the city, which could be a major factor in transport-related emissions. Cars also contribute significantly to the total vehicle count. The relatively low numbers of buses indicate a potential need for strengthening public transportation to reduce the city’s dependency on private vehicles.
Figure 3 illustrates the age distribution of various vehicle categories in Bengaluru. Among two-wheelers and three-wheelers, 48% are less than 5 years old, 37% fall in the 5-15 years range, and 15% are over 15 years old. For cars, 35% are under 5 years old, 34% are between 5-15 years, and 32% are older than 15 years. Buses and lorries show a similar pattern, with 42% of vehicles under 5 years, 38% aged between 5-15 years, and 20% older than 15 years.
This data indicates a higher proportion of older cars compared to other vehicle types, while two-wheelers and three-wheelers have a relatively younger fleet. The balanced distribution of buses and lorries suggests consistent replacement practices over time.
The contribution of different vehicle classes towards PM2.5 is shown in figure 4 below. The emission estimations were performed using standard procedures and emission factors provided by the System of Air Quality and Weather Forecasting and Research (Beig, 2018; Mangaraj et al., 2024, 2022).
Some salient points observed from estimation of emissions are:
- The transport sector alone generated 26.84 Gg of PM2.5 in 2023.
- Commercial Vehicles are the largest contributors, accounting for 49% of the total PM2.5 emissions, indicating their significant role in pollution levels.
- Cars contribute 20% of emissions, making them the second-largest category in PM2.5 pollution.
- Buses account for 19% of the emissions, showing a moderate impact despite their small numbers on the road.
- 2 Wheelers (11%) and 3 Wheelers (1%), collectively contribute smaller portions, with three-wheelers having the least impact.
This emphasizes the significant contribution of commercial vehicles to air pollution, highlighting the need for focused measures to mitigate emissions from the highest polluting fleet of vehicles and not the fleet with the highest vehicle count.
Health Care Cost Benefits of Electrification:
The estimation of monetary losses considered key relationships between emissions, concentrations, and health impacts to quantify the benefits of transitioning to EVs. A dispersion modeling study using the AERMOD model showed that a 20% reduction in PM2.5 emissions caused an equivalent 20% reduction in ambient PM2.5 concentrations (Mohan et al., 2011). This relationship is used in this study to scale the ambient pollution reductions under the different EV adoption scenarios.
Based on the emissions calculated for the year 2023, three interventions were tested to assess the impacts of EV adoption. These included, (a) converting all cars to EVs; (b) converting all light commercial vehicles (LCVs) and buses to EVs, and (c) a complete shift to EVs for all vehicles.
Emission reductions for each scenario were tentatively calculated, and the associated health cost savings were estimated based on reductions in particulate concentrations. The health and economic implications of air pollution were quantified, assuming that a 97% rise in PM2.5 concentrations in Bengaluru over the previous three decades resulted in ₹1922.83 crore losses in premature deaths, ₹516.88 crore losses in morbidity, and a ₹3309.6 increase in per capita health-care spending (Pandey et al., 2021). This approach enables a comprehensive assessment of the environmental and economic benefits of transitioning to EVs in Bengaluru, highlighting the potential for reducing health-care spending and improving air quality through targeted vehicle electrification strategies.
Table 2 below presents the impact of transitioning vehicles in Bengaluru to electric vehicles (EVs) on reducing PM2.5 emissions and associated health-related economic costs. The current scenario, with no interventions, results in significant healthcare costs, with mortality and morbidity losses of ₹4,045.54 crore and ₹1,309.17 crore, respectively, amounting to a per capita healthcare cost of ₹3,179.
Table 2: PM2.5 reduction and associated health-care costs from different EV transition scenarios in Bengaluru
| Interventions | % Reduction in concentration of PM2.5 | Benefits from reduced mortality (Crore INR/year) | Benefits from reduced morbidity (Crore INR/year) | Reduction in per capita healthcare cost (INR/year) |
| All cars to EV | 7.67% | 224.24 | 65.51 | 393.68 |
| All LCV and Buses to EV | 21.83% | 638.50 | 186.56 | 1120.96 |
| All vehicles to EV | 39.11% | 1144.03 | 334.26 | 2008.48 |
The improvement in air quality and associated health-care cost benefits from different interventions are listed below.
- Transitioning all vehicles in Bengaluru to electric vehicles (EVs) achieves the highest reduction in PM2.5 concentration (33.8%), followed by transitioning all light commercial vehicles (LCVs) and buses (18.9%), and all cars (6.6%).
- The greatest reduction in mortality costs is observed when all vehicles are converted to EVs, resulting in benefits of INR 1144.03 crore, compared to INR 638.5 crore for LCVs and buses and INR 224.24 crore for cars.
- Transitioning all vehicles to EVs yields the highest morbidity-related benefits of INR 334.26 crore, significantly higher than the benefits of INR 186.56 crore for LCVs and buses and INR 65.51 crore for cars.
- A full transition to EVs reduces per capita healthcare costs by INR 2008, far surpassing reductions achieved by LCVs and buses (INR 1120.6) or cars alone (INR 393.68).
Transitioning all vehicles to EVs maximizes the health and economic benefits, outperforming interventions limited to specific vehicle categories, highlighting the effectiveness of a complete transition in addressing air pollution and health costs.
In summary, transitioning vehicles to EVs in Bengaluru consistently reduces PM2.5 emissions, leading to lower health-related economic costs. Complete electrification of the vehicle fleet shows the highest economic benefits, demonstrating the importance of large-scale electrification for improving air quality and public health. The findings show that complete electrification of the vehicle fleet would cut emissions, PM levels, and healthcare costs the most in Bengaluru. This change would cut down on the Disability Adjusted Life Years (DALYs), improve air quality, and lower the healthcare costs per person.
References
BBMP, 2024. BBMP Municipal Corporation City Population Census 2011-2024 | Karnataka [WWW Document]. URL https://www.census2011.co.in/data/town/803162-bbmp-karnataka.html?utm_source=chatgpt.com (accessed 12.18.24).
Beig, G., 2018. SAFAR High Resolution Emission Inventory of Mega City Delhi -2018 (Special Scientific Report No. SAFAR-Delhi-2018-A). Indian Institute of Tropical Meteorology.
Beig, G., Jose, J., M, H.K., Behera, I., Mangaraj, P., Hussain, U., James, D., Srikanth, R., 2024. Emission Hot Spots and High Resolution Emission Inventory (200m) of Particulate Pollutants Using Drone Technology in Bengaluru Urban District (BUD) (Scientific Report No. NIAS/EI/2024/1). National Institute of Advanced Studies, Bengaluru.
Guttikunda, S.K., Nishadh, K.A., Gota, S., Singh, P., Chanda, A., Jawahar, P., Asundi, J., 2019. Air quality, emissions, and source contributions analysis for the Greater Bengaluru region of India. Atmospheric Pollut. Res. 10, 941–953. https://doi.org/10.1016/j.apr.2019.01.002
Mangaraj, P., Sahu, S.K., Beig, G., 2024. Development of emission inventory for air quality assessment and mitigation strategies over most populous Indian megacity, Mumbai. Urban Clim. 55, 101928. https://doi.org/10.1016/j.uclim.2024.101928
Mangaraj, P., Sahu, S.K., Beig, G., Samal, B., 2022. Development and assessment of inventory of air pollutants that deteriorate the air quality in Indian megacity Bengaluru. J. Clean. Prod. 360, 132209.
Mohan, M., Bhati, S., Rao, A., 2011. Application of air dispersion modelling for exposure assessment from particulate matter pollution in mega city Delhi. Asia-Pac. J. Chem. Eng. 6, 85–94. https://doi.org/10.1002/apj.468
MoRTH, 2024. Vahan seva dashboard [WWW Document]. URL https://vahan.parivahan.gov.in/vahan4dashboard/ (accessed 11.28.24).
Pandey, A., Brauer, 2021. Health and economic impact of air pollution in the states of India: the Global Burden of Disease Study 2019. Lancet Planet. Health 5, e25–e38. https://doi.org/10.1016/S2542-5196(20)30298-9
Prabhu, V., Singh, P., Kulkarni, P., Sreekanth, V., 2022. Characteristics and health risk assessment of fine particulate matter and surface ozone: results from Bengaluru, India. Environ. Monit. Assess. 194, 211. https://doi.org/10.1007/s10661-022-09852-6


More Stories
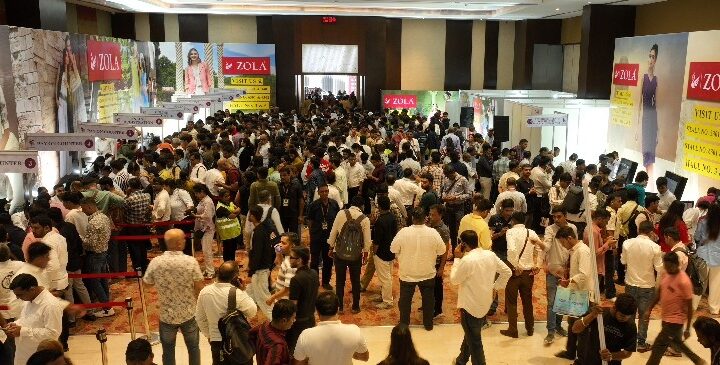
CMAI’s 83rd National Garment Fair Sets A New Benchmark With Record Footfalls, 48,500 Trade Buyers And Strong Business Generation.
Venture Capital Must Evolve Beyond Traditional Fund Cycles to Unlock India’s Deep-Tech Potential: Equirus InnovateX Fund.
Palmonas Marks Global Expansion With The Launch Of Its First International Store In The UAE.